To demonstrate how much longer the bubble activity lasts compared to the duration of the lithotripter pulse, we use the Gilmore-Akulichev model. This predicts how a pre-existing small gas bubble, which is assumed to remain spherical at all times, expands and contracts in response to the high compressive pressure, followed by a longer period of tension, which typifies the lithotripter pulse (Figure 3).
The result is plotted in Figure 4, which superimposes the lithotripter pressure pulse of Figure 3 on a plot of the bubble radius time history. The 60 MPa compressive part of the lithotripter pulse (red) causes the bubble radius (yellow) to decrease: the bubble collapses, but then rebounds. It then remains expanded for ~ 200 ms, before undergoing a series of collapses on rebounds. The amplitude and interval between the rebounds decreases.
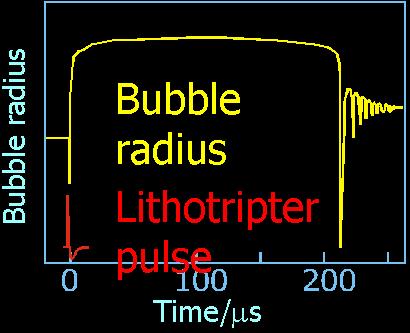
Figure 4. Superimposition on a common time axis of the lithotripter pulse (red) and the resulting bubble radius time history (yellow)
Each time the bubble rebounds it emits a pressure wave, and these are the source of the peaks (i, ii, iii) measured in the data (Figures 1 and 2). From these peaks we can monitor the cavitational activity and hence the damage to the stone.
As explained above, this model assumes that the bubble is always spherical. This is not realistic, as the next slide will show. Nevertheless the Gilmore-Akulichev model gives a good feel for the source of the peaks in the acoustic emission, and how we might interpret that emission to find out what kind of cavitation is occurring in the human body during lithotripsy.
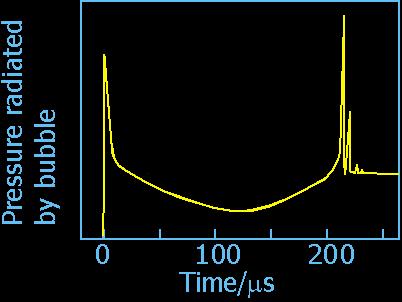
Figure 5. Plot of the far-field radiated pressure which the bubble motion of Figure 4 causes
For the
homepage of the Ultrasonics and Underwater Acoustics (UAUA) Centre, click ![]()
© T G Leighton 2003