|
Baffled Pinnae
The
reason for measuring and simulating the response of baffled pinnae is mainly
since the main high frequency features of HRTFs can be found in the response
of these models (see Shaw, 1974).
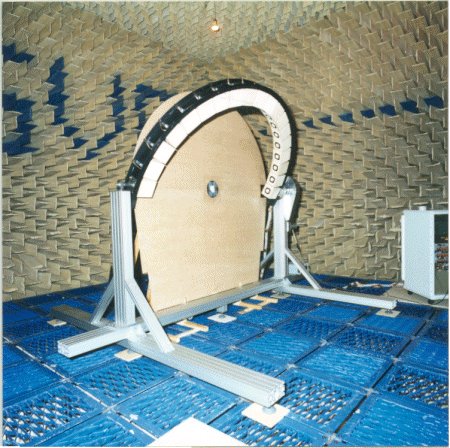
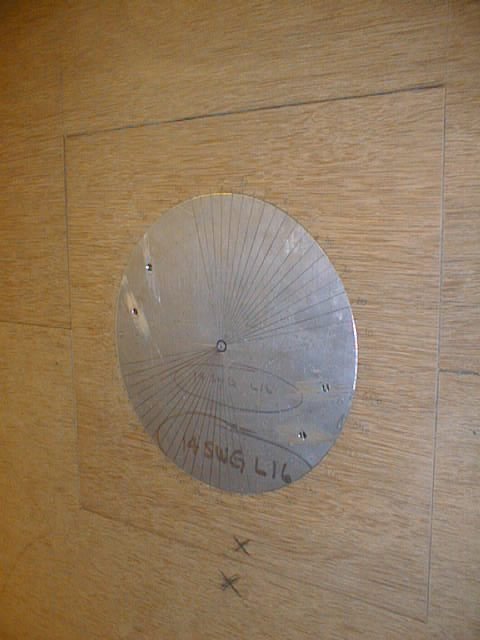
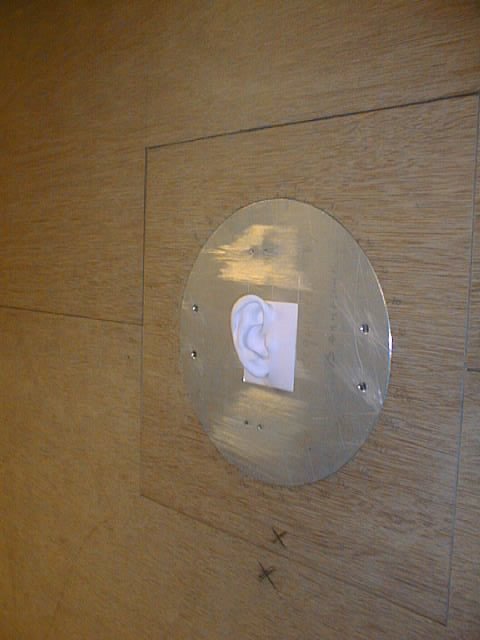
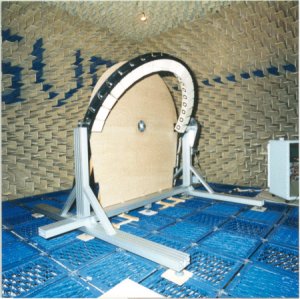
A large baffle was constructed
out of thick plywood. Its large dimensions (with a maximum width of 2.3
m, and a maximum height of 2.4 m) ensured that the measurements of the
acoustical response of the pinna are not distorted due to diffraction and
reflection from the boundaries of the baffle. In the centre of the baffle
a circular aluminium plate was positioned, able to rotate around its centre,
and a rectangular opening enables the positioning of the artificial pinnae.
An additional circular plate included an opening for the holding Electret
microphone, flush mounted with the baffle plane. This was used for equalisation
of the transducers for each source position in space. |
 |
|
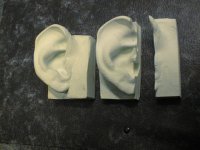
An external ear was moulded in
the Hearing and Balance Centre of the ISVR. The moulding was created in
two stages, to make sure that both the internal part of the external ear
(concha, and 1 cm inside the ear canal) as well as the outside part around
the pinna is captured. Two plaster models were created from the negative
mould. With one was cut along the long side of the ear and included the
cross section of part of the ear canal that was moulded. This cross section
was required in the scanning process, to ensure all the curved parts of
the pinna are captured. The frame of the plaster model was shaped and attached
to an approximate rectangular frame, in a similar way to which the KEMAR
pinnae are produced, so that it can be attached to the baffle in the anechoic
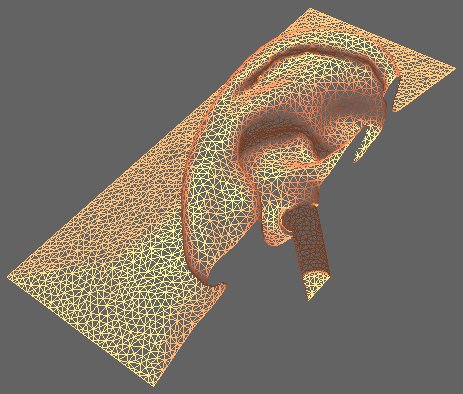
chamber for measurements. The mesh model was decimated and mipulated to
ensure accurate simulation up to 20 kHz. |
|
Measurements of six pinnae (four
of KEMAR, one of Brüel and Kjær 4127 Head and Torso Simulator
(HATS), and a replica of YK pinna) were undertaken and repeated a few times
to ensure repeatability. All measurements were run automatically where
a full scan of the entire sphere in a resolution of 2° took approximately
one hour. A large amount of data was collected
for all six pinnae, with frequency response measured at high resolution
sampling of the hemisphere. |
|
To
the mesh model of the pinna an earcanal was added. The motivation of inclusion
of a simple cylindrical canal has been raised due to variations among individuals
for the canal shape, size and eardrum boundary conditions. Therefore we
include an average ear canal with dimensions based on the Zwislocki coupler
(Zwislocki, 1970), and the boundary conditions based on average data published
by Shaw (1974). |
 |
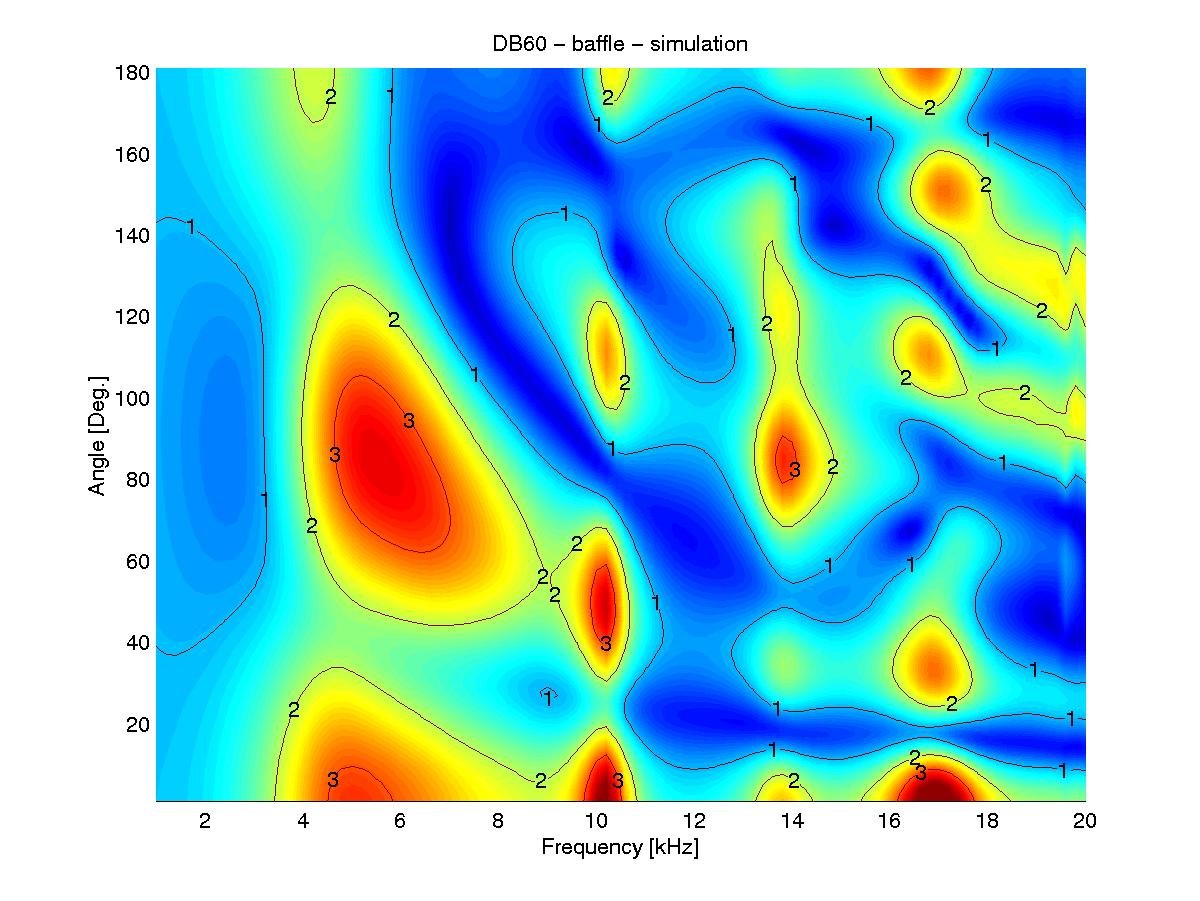
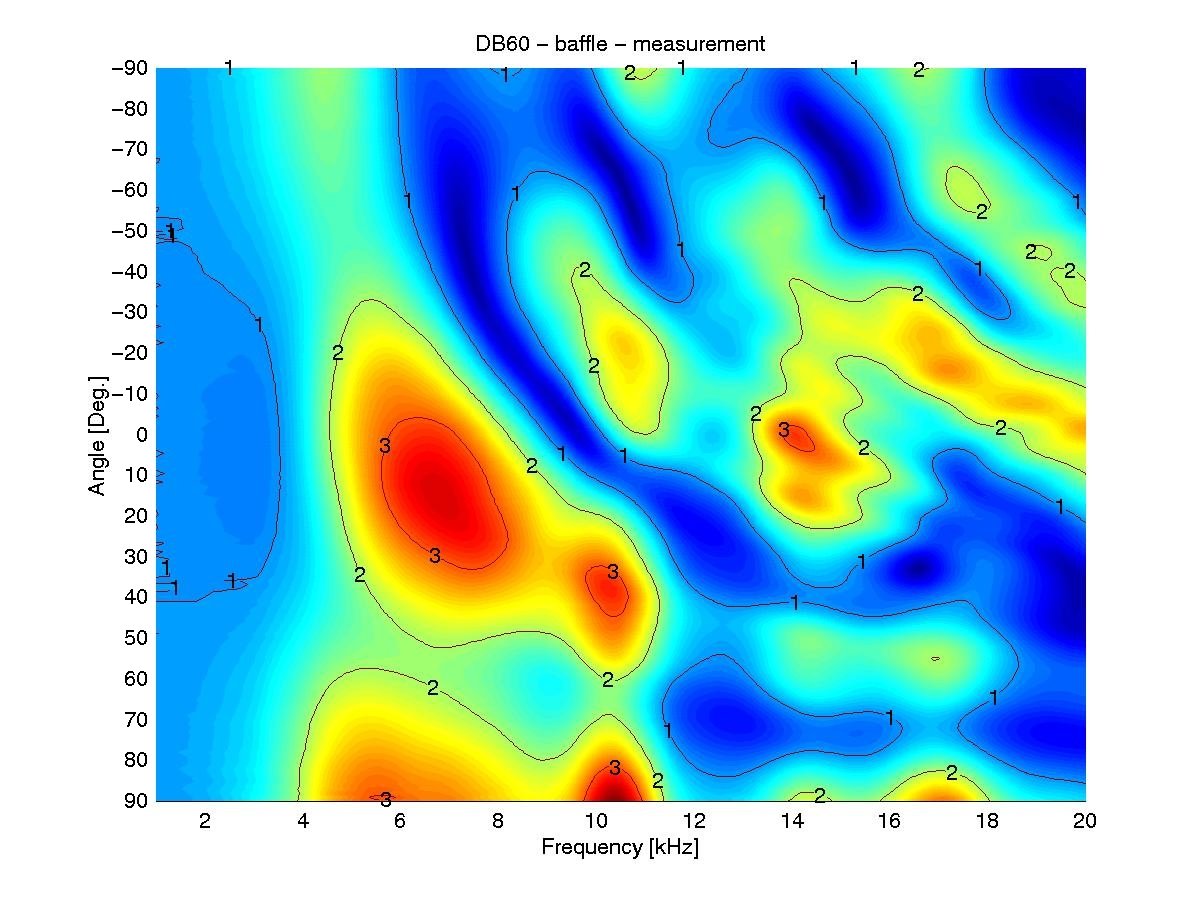
The figures below show an example
of a spatial map of continuous variation of spectral peaks and notches
of the baffled DB60 pinna in the lateral vertical plane. Both simulations
and measurements were undertaken at a resolution of 1°. The contours
show amplification in steps of 1, 2, 3 and 4 times the response detected
at the equalisation point at the centre of the baffle (without the pinna).
It is interesting to observe how the general trends are replicated for
all angles and all frequencies albeit with amplitude differences at the
higher frequency range.
Up |